Flourish brought Data visualization to next level, Understanding data becomes more easy
November 29, 2022 By Jozeph P
(Image Credit Google)
A good chart, graph, or map can make or break an argument. This holds whether you're tracking election results or evaluating health data from your Android smartwatch. Data visualization used to be a time-consuming task that needed a basic understanding of a coding language such as JavaScript or R.
Fortunately, times have changed, and there are now numerous low-code or no-code data visualization tools available. Tableau and Microsoft Power BI are two tools that can help you create dynamic, interactive charts.
Although Google does not have a consumer-facing data visualization tool on its platform, it collaborates with the London-based Flourish to continue providing free access to newsrooms.
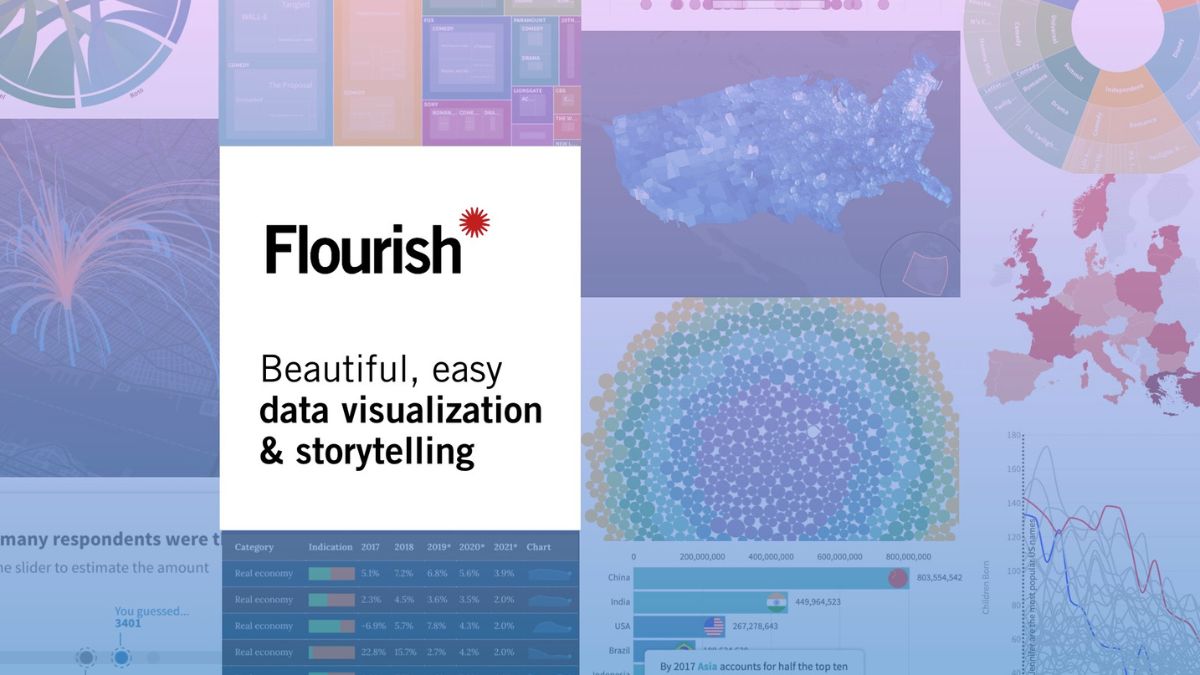
[caption id="attachment_67287" align="aligncenter" width="1640"]
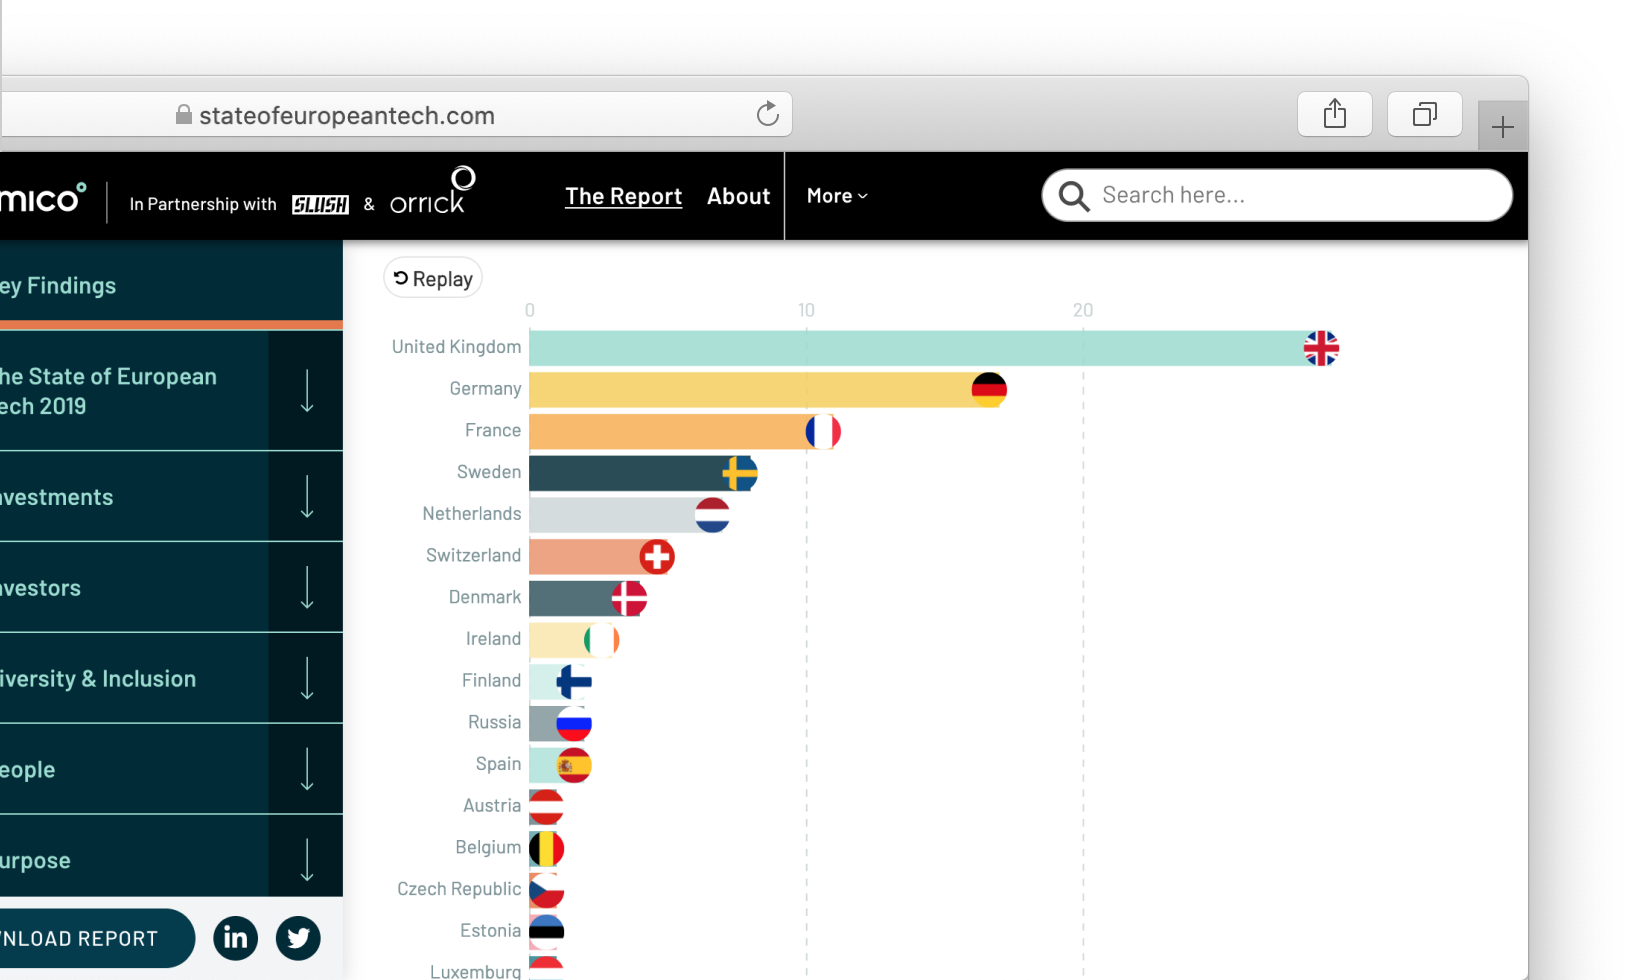
Image: Flourish[/caption]
What is Flourish?
Flourish is a robust data visualization tool created by a group of software engineers, data visualization experts, and data journalists. It enables those who are less technologically savvy to quickly create high-end visualizations and stories using any data that can be entered into a spreadsheet. This data can represent anything you want it as time, population, location, or anything else you want to show.
Flourish was founded in 2016 as a tool to help newsrooms visualize data and trends in new ways. In 2017, the company partnered with Google News Lab to provide free team accounts to all newsrooms worldwide. Canva, a popular graphic design platform, acquired Flourish in 2022. The company's paid tiers unlock even more-powerful data visualization options.
[caption id="attachment_67290" align="aligncenter" width="2048"]
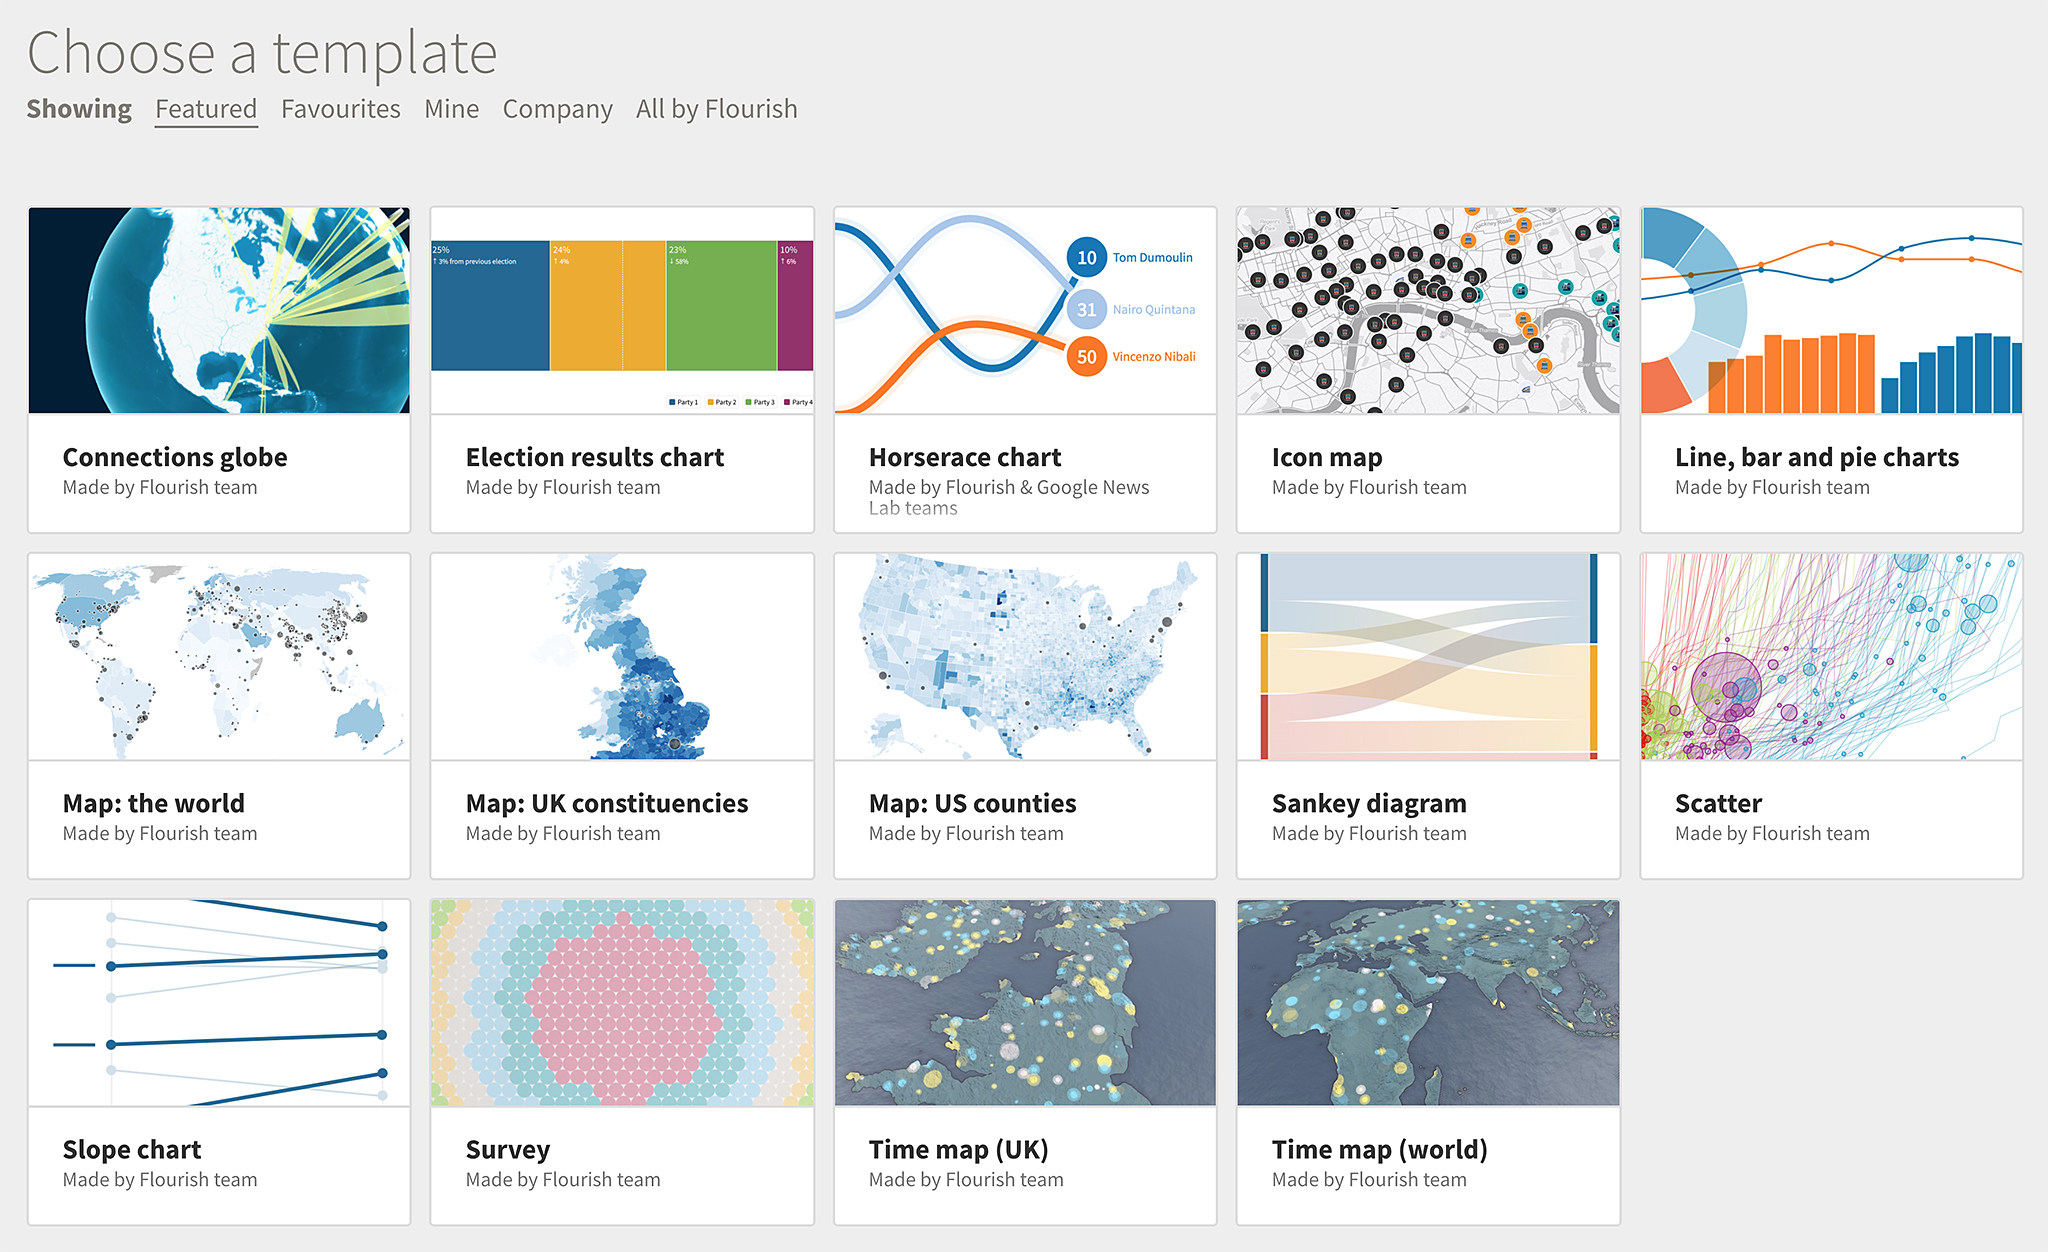
Image: Flourish[/caption]
What is Flourish capable of?
The results are easily embeddable into most websites, and they automatically resize depending on the user's screen size and device size.
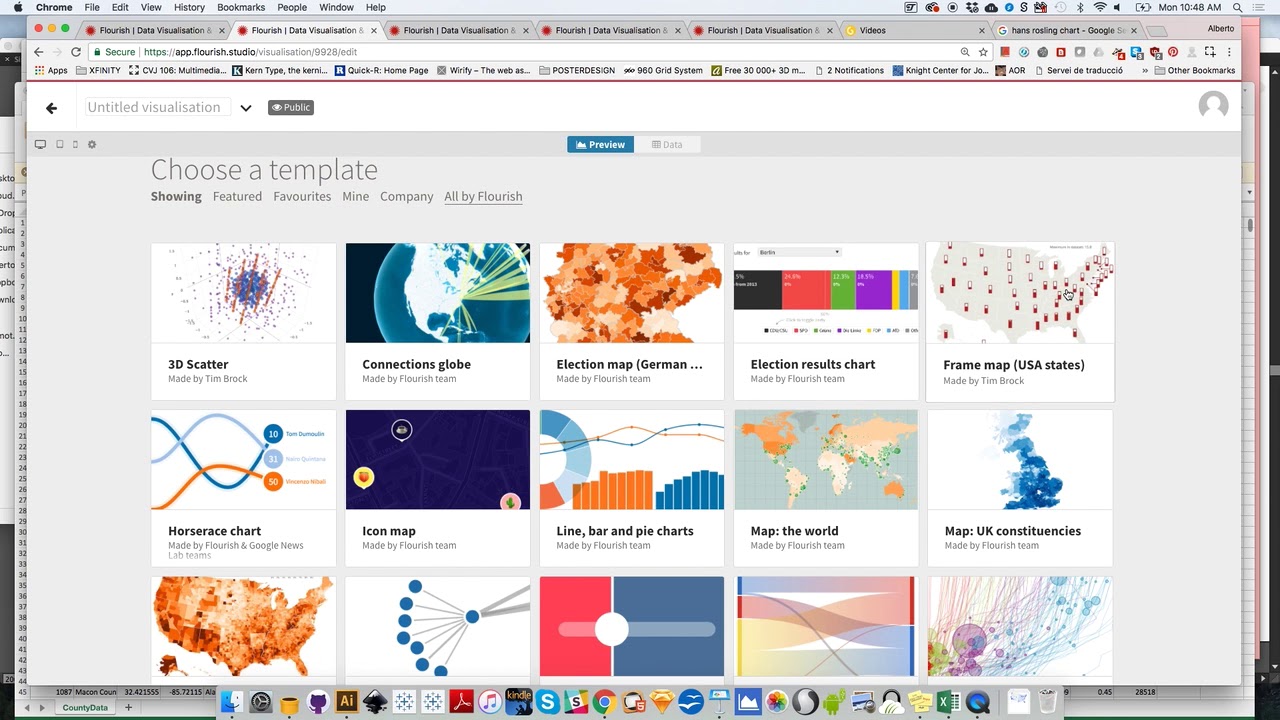
What can you do with the Flourish free version?
Even if you don't work in a newsroom, you can register for a free account and use Flourish's powerful features. There are over 150 free templates to choose from, and there is no cap on the number of projects you can create.
There is one major limitation to the free version of the product: Every project must be hosted on Flourish's site.
What do the paid versions of Flourish let you do?
Flourish's paid version is intended for industries rather than individuals. You can obtain live data from Google Sheets, custom themes, and password-protected visualizations in the Publisher tier. It also allows you to use "scroll telling," which displays different slides as you skim down the screen.
How to Use Google Data?
If you intend to use Flourish, you must first learn how to use excel sheets for data visualization. Google Sheets is a powerful and user-friendly spreadsheet program, and we've put together a guide with tips and tricks for using the tool.
By Jozeph P
Journalism explorer, tech Enthusiast. Love to read and write.